
Guide to accessing your browser logs and generating a HAR file for troubleshooting purposes
When you report an issue or a bug to our team, you may be asked to send some browser information that could initially seem daunting to locate. This quick explainer article will show you how to find your browser's console or generate a HAR (HTTP Archive) file for our network team to debug.
What can I use the HAR file for?
HAR file information visually represents what is happening with your browser's network. It's beneficial for debugging network errors or problems with buffering, loading, and other unexpected behaviors.
Step 1 - Open the developer tools panel
Google Chrome
To open the dedicated Console panel:
-
On Windows/Linux, press Ctrl + Shift + J
-
On Mac, press Cmd + Option + J
To open the dedicated Network panel:
-
On Windows/Linux, press Ctrl + Shift + I
-
On Mac, press Cmd + Option + I
You can also open the Developer Tools panel where these features are located by clicking the three-dot menu on the top-right corner of your browser and clicking More tools > Developer tools.
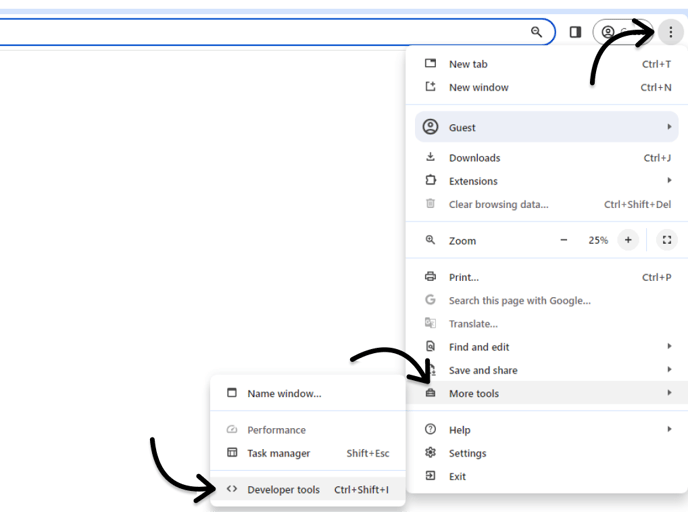
Once inside the Developer Tools panel, you can navigate to the various panels at the top of the window (Elements, Console, Network, Sources, Performance, etc.).

Mozilla Firefox
To open the dedicated Console panel:
-
On Windows/Linux, press Ctrl + Shift + K
-
On Mac, press Cmd + Option + K
To open the dedicated Network panel:
-
On Windows/Linux, press Ctrl + Shift + E
-
On Mac, press Cmd + Option + E
You can also open the Web Developer Tools panel by clicking the hamburger (three lines) menu icon at the top-right corner of your browser and then selecting More tools > Web Developer Tools.

Once inside the Web Developer Tools panel, you can navigate to the various panels at the top of the window (Inspector, Console, Debugger, Network, etc.).

Safari
You can open the developer console by pressing Cmd + Option + C, or right-clicking on the webpage and selecting "Inspect Element."

If you don't see the option, enable it in the Safari settings. Do it by navigating to Safari > Settings and checking the "Show features for web developers" box under the "Advanced" tab.

Once inside the Web Developer Tools panel, you can navigate to the various panels at the top of the window (Console, Sources, Network, Timelines, etc.).

Step 2 - Generate a HAR file
There are a few ways to generate a HAR file depending on your browser. Click on your browser below to see how.
Google Chrome
Navigate to the Network tab as explained above. Ensure the round button at the top-left part of the panel is red and check the "Preserve log" box. Next, recreate the issue you're experiencing. Try loading that faulty file, get that buffering problem to rear its ugly head, etc.
Once you have recreated what you need to capture, save the HAR file by clicking the download button (Export HAR), as shown below.

Firefox
Navigate to the Network tab as explained above. Before recreating the issue, make sure you're recording it. Once you have recreated the issue and captured the logs, you can export the HAR file by clicking on the gear icon in the top-right corner and selecting Save All As HAR.

Safari
Navigate to the Network tab as explained above. Before recreating the issue, make sure you have selected Preserve Log. Once you're done recreating the problem and have captured the logs, click Export in the top-right corner of the panel.
